Introduction: Why Global AI Adoption Numbers Don’t Tell the Full Story
AI adoption figures are everywhere.
“60% of small businesses use AI.”
“Only 12% have adopted AI formally.”
“Emerging markets are racing ahead.”
All of these statements can be true — and misleading at the same time.
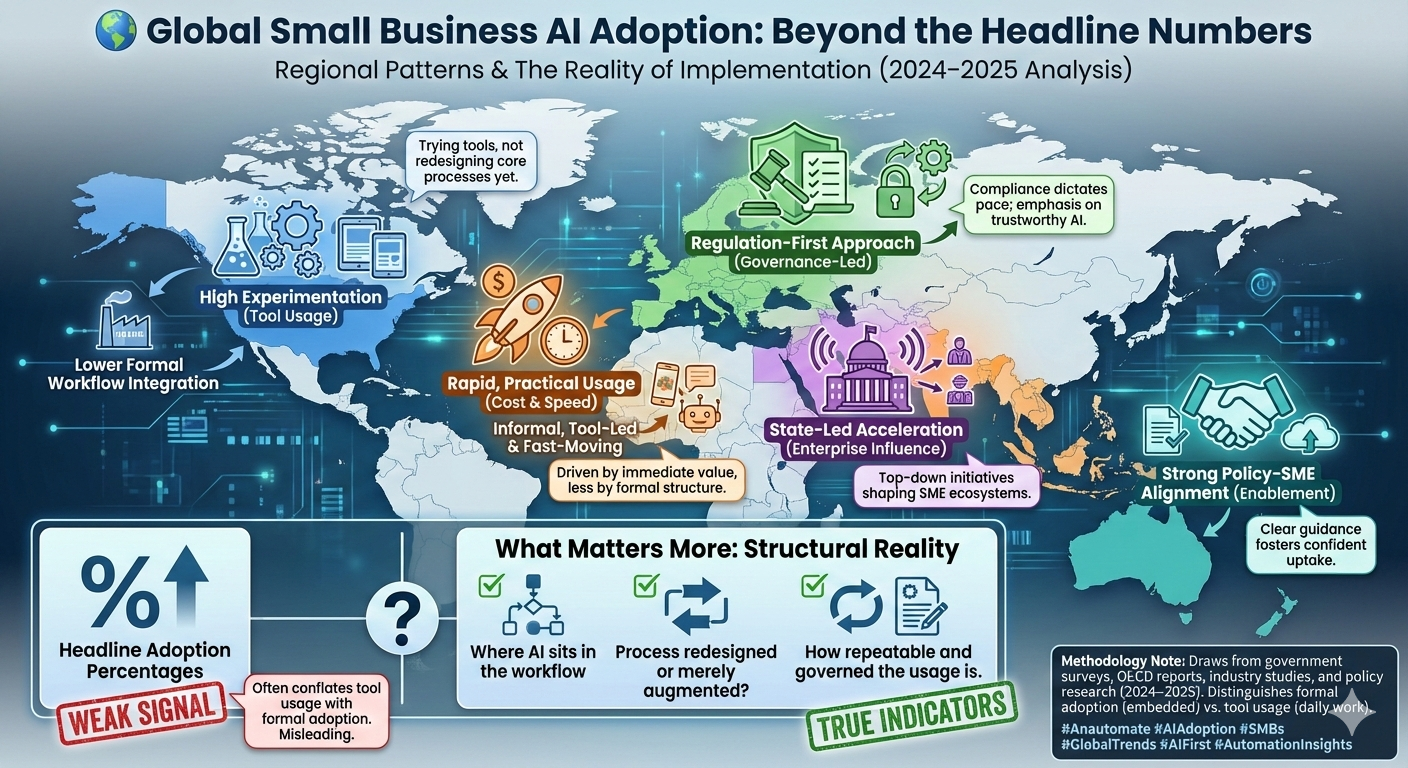
When we analysed global studies across regions, one thing became clear: AI adoption looks wildly different across countries, not because of ambition — but because of structure, policy, and context.
This blog looks beyond headline percentages to examine how AI is actually being used by companies worldwide, especially small and mid-sized businesses. You can also read our guide on building an automation mindset here.
The Core Insight: Usage ≠ Adoption
Most global studies fall into two very different camps:
Formal AI adoption
→ AI embedded into producing goods or delivering services
AI tool usage
→ GenAI, copilots, automation tools used in daily work
Many reports blend the two. That’s where confusion starts.
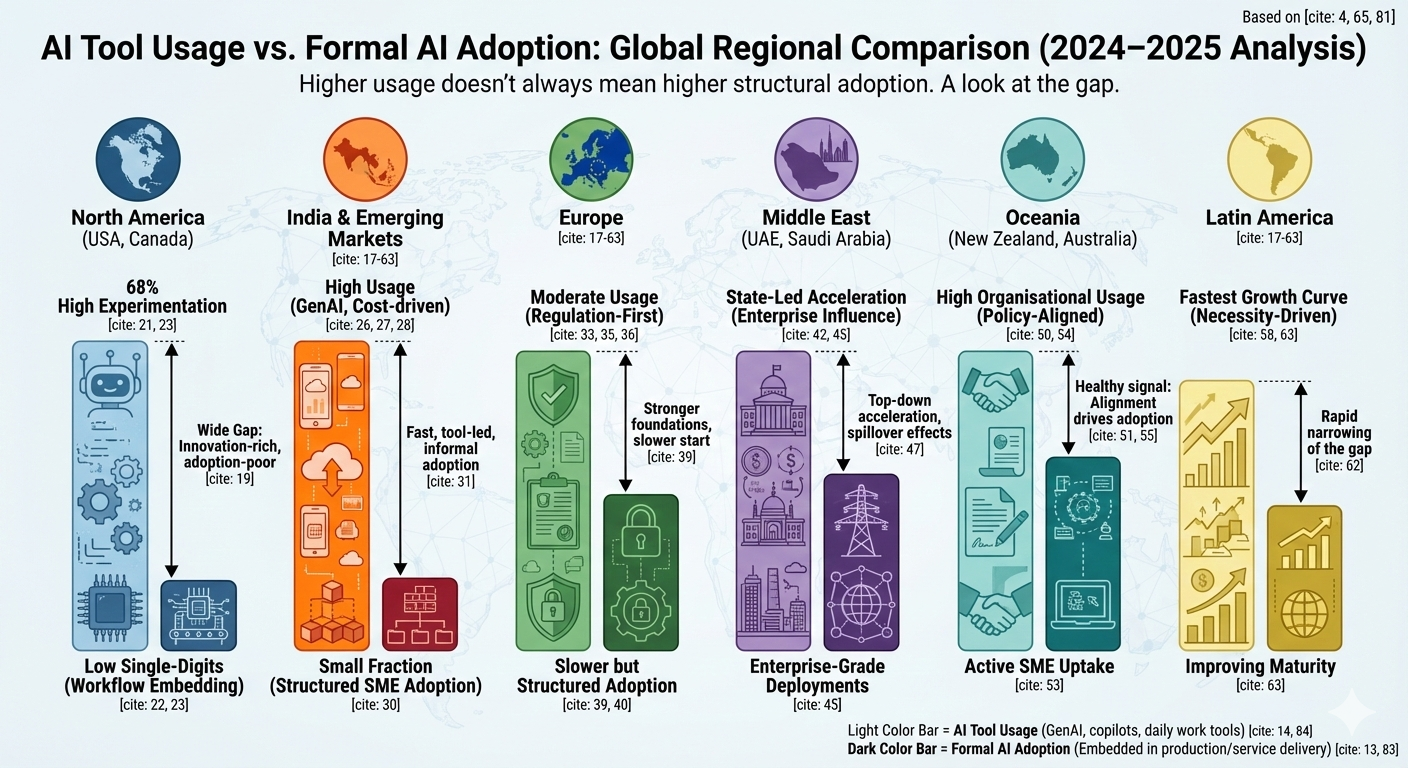
A country may show high AI usage but low structural adoption — and that difference matters far more than the percentage itself.
Regional Patterns in AI Adoption (What’s Really Happening)
🇺🇸 North America (United States & Canada)
Innovation-rich, SME adoption-poor
North America leads the world in AI innovation and tool availability. Yet formal SME adoption remains surprisingly low.
Industry and chamber surveys show 58–68% of U.S. small businesses self-report using AI tools. Government surveys, using stricter definitions, report single-digit to low-teens formal adoption.
Pattern: High experimentation → low workflow embedding.
Many businesses are trying AI, but fewer are redesigning core processes around it.
🇮🇳 India & Emerging Markets
High usage, low structured SME adoption
India stands out as a global leader in Generative AI usage.
• Rapid uptake driven by cost, speed, and accessible tools
• Strong productivity gains reported at individual and team levels
• Yet only a small fraction of SMEs have AI formally embedded into operations
Pattern: Fast-moving, tool-led, informal adoption — driven by immediate value rather than governance.
This creates speed, but also fragility.
🇪🇺 Europe
Regulation-first, structure-led adoption
Europe shows lower headline adoption numbers — but for a reason.
• Strong regulatory frameworks (EU AI Act)
• Clear distinctions between experimentation and production use
• Emphasis on governance, risk, and repeatability
Pattern: Slower start, stronger foundations.
European SMEs are less likely to “try everything,” but more likely to institutionalise what they adopt.
🌍 Middle East (UAE, Saudi Arabia)
State-led acceleration
The Middle East presents a distinct model.
• Government-driven AI strategies
• Enterprise-grade deployments influencing SME ecosystems
• Strong investment, infrastructure, and talent attraction
Pattern: Top-down acceleration, with SMEs benefiting from spillover effects.
This is not grassroots adoption — it’s systemic enablement.
🌏 Oceania (New Zealand, Australia)
Policy + SME uptake alignment
Oceania shows one of the healthiest signals globally.
• Clear policy direction
• Active SME enablement
• High organisational AI usage, especially in New Zealand
Pattern: When guidance, skills, and incentives align, adoption follows naturally.
This is what “sustainable AI adoption” looks like.
🌎 Latin America
Fastest growth curve
Latin America may not lead in absolute numbers — but it leads in momentum.
• Sharp year-on-year growth in AI tool usage
• Strong focus on marketing, customer engagement, and operations
• Rapid narrowing of the gap between large firms and SMEs
Pattern: Necessity-driven acceleration with improving maturity.
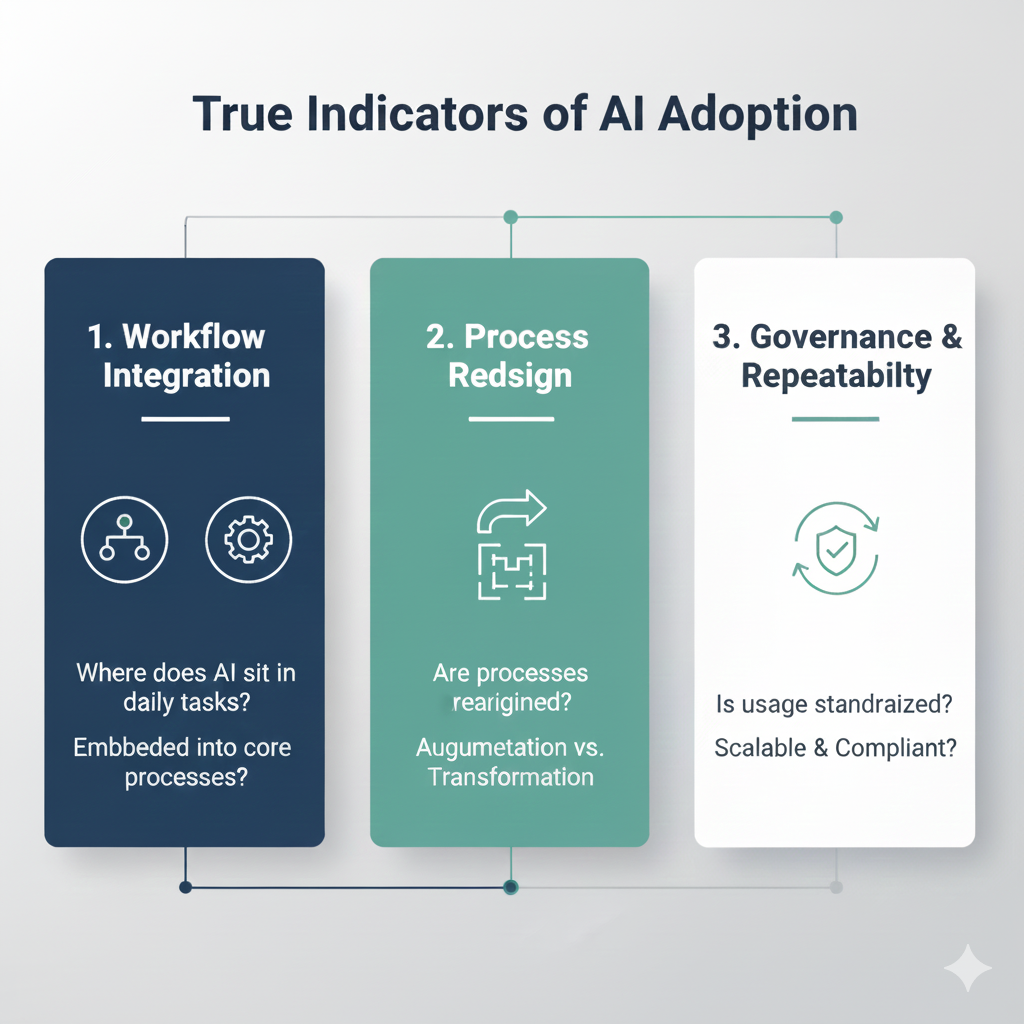
What Actually Matters More Than Adoption Percentages
Across all regions, three indicators consistently matter more than headline numbers:
1. Where AI sits in the workflow
Is it peripheral, or mission-critical?
2. Whether processes were redesigned or merely augmented
Automation layered on chaos doesn’t scale.
3. How repeatable and governed the usage is
One-off experiments ≠ organisational capability.
These factors determine whether AI creates lasting advantage — or short-term novelty.
Methodology Note (Important Context)
This analysis draws from:
• Government surveys and statistical offices
• OECD and multilateral reports
• Industry and chamber studies
• Policy and academic research (2024–2025)
Crucially, many sources explicitly distinguish between:
Formal AI adoption (embedded in production or service delivery), and
AI tool usage (daily operational support tools)
Percentages vary significantly depending on which definition is used — and that variation is not noise. It’s the signal.
Why This Matters for Businesses in 2026
The global story of AI adoption is not about who is “ahead.”
It’s about how adoption happens, under what constraints, and with what long-term structure.
In 2026, competitive advantage will not come from using AI.
It will come from embedding AI intelligently into repeatable business systems.
That’s the difference between experimentation and transformation.
Closing Thought
Global AI adoption is uneven — not because companies lack intent, but because ecosystems shape outcomes.
If you look only at percentages, you miss the point.
If you look at patterns, structure, and design — you start to see where real value is being built.
👉 Want to Build Sustainable AI Adoption for Your Business?
Let’s design AI workflows that create lasting competitive advantage.
📩 Contact us: contact@anautomate.com